Plotter Overview
The Plotter is a piece of software intended to support the testing and deployment of Theia systems.
It provides the following features:
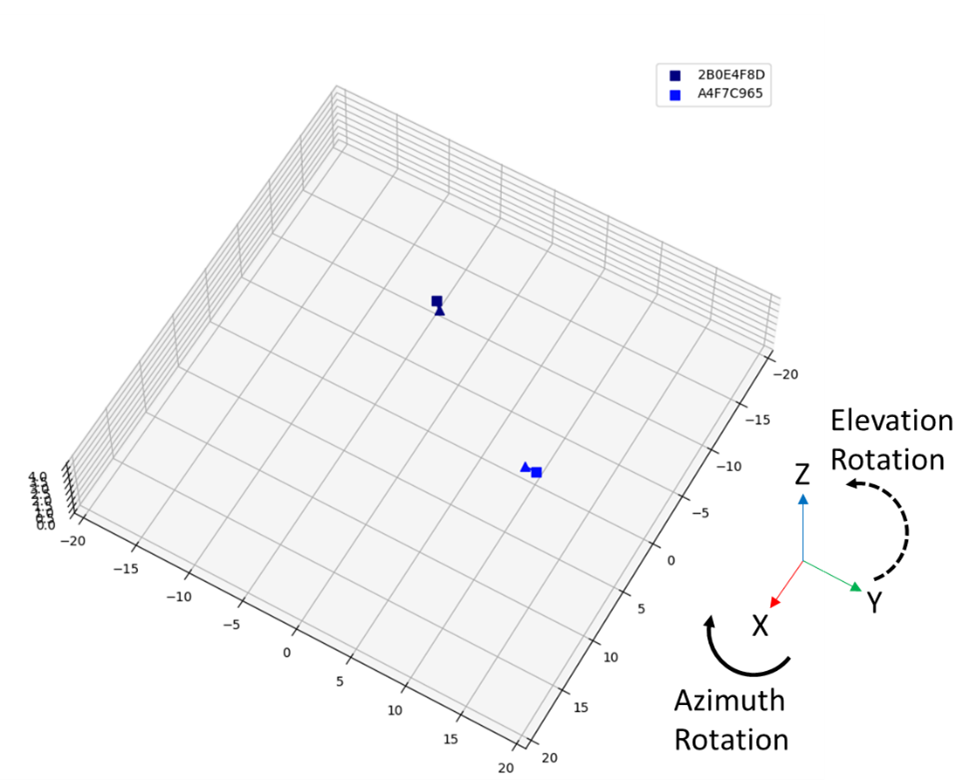
- Spatial visualization: The position of all tags detected by the system is plotted in real time in 3D space, to be visualized.
- Multi-radar aggregation: The observations of several radars can be seamlessly aggregated to enable calibration and large-area implementation.
- Filtering: The raw position observations can be post-processed to enable smoother and more accurate position estimates over time.
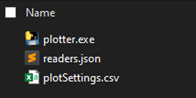
The Plotter software is supplied in a zipped folder consisting of an executable and of two configuration files. All of these files should remain in the same folder.
Using the Plotter
To use the plotter:
- Physically set up all the radars and tags of the system.
- Make sure that the computer (selected to run the Plotter) and all the radars are on the same local area network (LAN).
- Determine the IP address of the computer selected to run the Plotter.
- Change the IPAddress parameter
settings.csvof all the radar configuration SD cards to the IP of the computer. Also take note of their MAC addresses stored inMAC.txtfiles. - Unzip the plotter folder.
- Change the
readers.jsonfile on the computer to indicate the known positions and orientations of the radars. - Change the
plotSettings.csvon the computer to adjust the size of the visualization box (all dimensions in m). - Launch the
plotter.exeexecutable.
warning
Make sure that the computer running the plotter allows the reception of UDP messages on network port 2000. Firewall activity on the computer can prevent any of the messages sent by the readers from being received by the plotter.